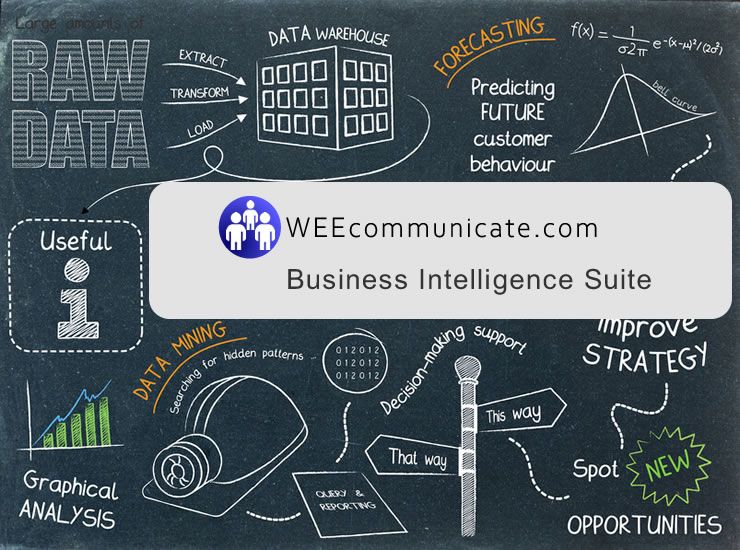
Convert Data into Business Intelligence
Product News
Every day your business creates an overwhelming amount of data. Analytics tools such as Google Analytics deliver massive reports about traffic data to your website, but they are often overwhelming - and they only show anonymous information. Team members present the latest charts about their success stories, focusing on their departments. Then, managers are bombarded with spreadsheets with unverified data, often outdated. Fact is that data reports often boils down to being noise, just a lot of information that remains unstructured and to be honest - not very helpful in many cases.
Corporations focus mostly on revenue reports when measuring performance. Member driven organizations face a bigger dilemma due to the complexity of their business model. Success factors are not mere revenue numbers. A success of an association is defined by many factors such as member engagement, interactions, committee involvement, event participation, donations, sponsorship, grants, and of course member dues - just to name a few.
Why is this an issue? Each of the success factors live in departments, or silos. While it is certainly easy to run reports of - let say event registrations, it becomes much more challenging to create purposeful reports that make sense across departments.
Traditional member management software or CRM systems are great in creating charts about member dues, cash flow, overdue member invoices, or number of contacts. Unfortunately these reports have one flaw in common: they report data within the silo where the data was generated.
But what does this all mean to you? Should imperfect reports really impact your thinking? Does it help you with defining your winning strategy? In other words, do you learn anything that helps you in your decision making for your organization?
Converting data into true business intelligence requires a more innovative approach.
1. Break down data silos by choosing an All-in-One Software solution
The more software application your organization is using the more compromised the data quality will become. This is why WEEcommunicate has developed an All-in-One Solution that creates a holistic picture of your organization across all departments, divisions, teams. This translates into real-time reporting across teams, and lower IT costs because costly software to compile silo data is no longer necessary.
2. Define the purpose of the report
Every report has a purpose. This is why we render reports in all APPS focusing on the needs of the user who wants to create the specific report. Member Outreach teams may want to show the top 10 potential members based on past engagement numbers. Marketing teams may focus on site traffic and identify who is driving page view to specific pages. Both reports collect data points of multiple departments and render them according to their specific purpose. Data silos have ceased to exist!
3. Render meaningful Business Intelligence reports
The reports tell a story which assists in taking the right decisions for your organization. Rather than pure descriptions of data WEEcommunicate built an advanced algorithm that combines different data points to answer difficult questions. An example would be: what are the main topics of interests page visitors are interested in - and who are they? While the first part is easy to address, identifying your audience is not. We believe that this is the difference between data and business intelligence.
Since all reports are generated in real-time without any time lag they are representing up-to-date information.

What’s in it for you?
We are pleased to announce that WEEcommunicate will introduce the latest version 6.0 with an advanced Business Intelligence in January 2023.
It’s the right time for your organization to rethink what is possible. Contact us for a preview of this innovative solution that can elevate your decisions making in 2023.
Related
Address
WEEcommunicate.com
3109 Grand Avenue , Ste 416
Miami, FL 33133
USA


